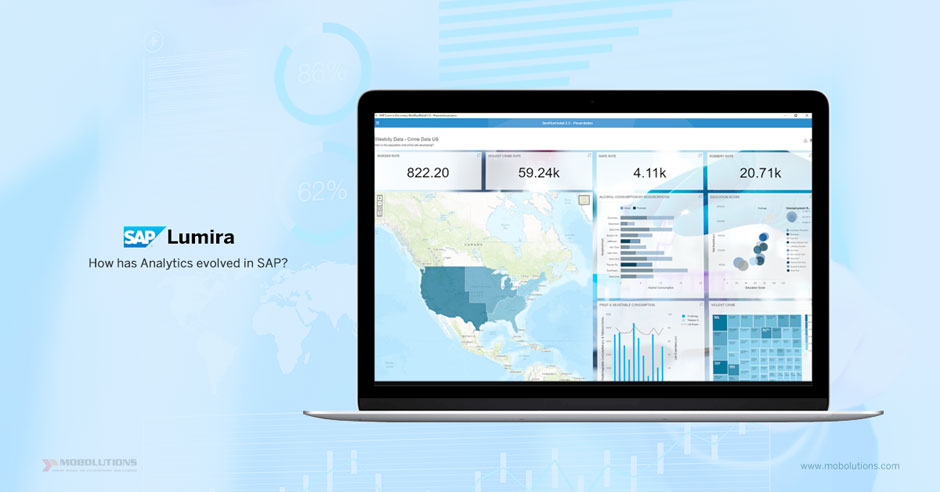
SAP Lumira – How has Analytics evolved in SAP?
Today, the place that analytics has gained in decision-making and becoming a significant component to driving profit is unquestionable. In the past, when business analytics technology was still evolving, there was heavy involvement of technical staff and statistical staff to comprehend all the data and turn it into usable information. With the advancement in technology, the analytics solutions today are extremely user-friendly and can be used by anyone with little technical expertise with ease.
How advanced is SAP Lumira?
SAP Lumira was initially called SAP Visual Intelligence upon its release in 2012. It ensures that customers can gain insights from trusted enterprise data sources and personal data and share those insights on desktop browsers and mobile devices.
With Lumira’s drag-and-drop interface, business users can transform and visualize data in a repeatable and self-service way. With a few clicks, data from multiple sources can be gathered and combined. You can access stunning visualizations that enable users to quickly analyze data without the need for scripting.
| Key trends in the business | Value Propositions |
| Consumerization of Analytics: Customers increasingly expect consistent and engaging user experiences while using analytics | SAP Lumira is based on modern UI technologies such as SAPUI5 and is Fiori compliant; it can, therefore, be consumed in browsers of multiple platforms. |
| Business users aim to explore enterprise and personal data sources to respond to business questions which otherwise cannot be answered from centrally provisioned reports and analyses. | Provision of specific tools for business users to create simple dashboards in a self-service manner |
| Cost Reduction: Integrate optimally into the existing landscape and ensure cost-effective operation of a software solution. | Integrates with existing system landscapes and provides scalable, secure and enterprise-ready operation of large analytics deployments |
The comparison chart below provides details on the various features included in each edition or version of SAP Lumira software.
Source: SAP
Feature Highlights and Future Roadmap
Though SAP has several other analytics solutions such as SAP Crystal Reports, SAP Design Studio, BI platform, SAP Dashboards, SAP Analysis for Office etc. SAP Lumira has topped several user ratings for being most user-friendly. Lumira has over time integrated with other SAP analytics solutions and the most well-received being SAP Lumira with SAP Design Studio. This combines both self-service analytics with professional and authored dashboarding.
| SAP Lumira, discovery edition |
SAP Lumira, designer edition |
SAP Lumira, server edition |
|
| Access to XLSX and CSV files | ● | ● | ● |
| Access to SAP data sources | ● | ● | ● |
| Access to relational data sources, Big Data sources, etc. | ● | ● | ● |
| Combination and transformation of data | ● | ● | ● |
| Creation and editing of storyboards | ● | ● | ● |
| Secure sharing | ● | ● | ● |
| Web and mobile browser support | ● | ● | ● |
| Ability to design centrally governable visual analytics content | ● | ● | |
| Broad publication with easy scalability | ● | ● | |
| Integration with SAP BusinessObjects Business intelligence suite | ● | ||
| Trial available | ● | ||
| Administration | stand-alone | stand-alone | administration console |
SAP Design Studio content can be exported to Lumira. For instance, a sports goods shop owner is reviewing her performance insights with Design Studio. This user can filter, sort, slice and dice the data. But if the owner wants to integrate shop performance data with weather reports to see how the weather influences shop performance, she needs to export the SAP Design Studio data to Lumira to blend data. Bringing a Lumira storyboard directly into Design Studio is also possible today.
- Lumira can present complex graphing with 3D, heat and bubble charts
- Create map-based charts using geolocational data to view information by country, state, county, city etc. with the ability to drill down by clicking within the map
- Add text, images, shapes, pictograms, and input controls through simple drag-and-drop functionality
- Add formulas, create time and geographical hierarchies, merge data sets, create measures, clean and format data without the use of code or scripts
- Simple options for collaborating, sharing documents and datasets
Interested to know more on how to identify the right SAP Analytics solution for your business? Leave us a note to get in touch with the Analytics experts.


